
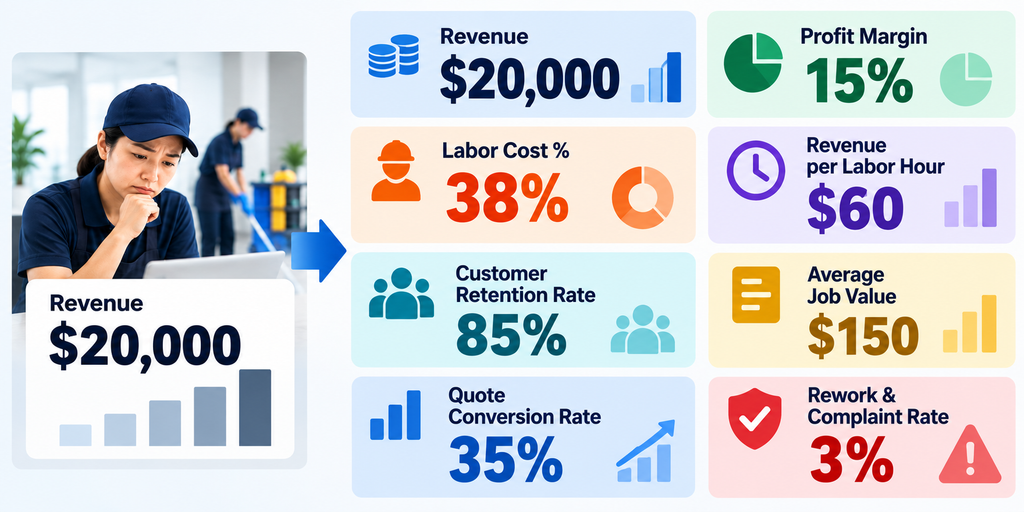
Revenue alone does not tell you whether your cleaning business is healthy.
You can increase sales while labor costs rise, low-profit jobs consume your schedule, customers leave, or rework quietly reduces your margin.
That is why cleaning business owners should track a small set of key performance indicators, or KPIs.
The right KPIs help you understand what is happening behind your revenue and identify problems before they become expensive.
You do not need dozens of complicated metrics.
For most cleaning businesses, a focused dashboard covering profitability, labor efficiency, customers, sales, and service quality provides a much clearer picture of performance.
In this guide, we will cover 10 cleaning business KPIs you can start tracking and show you how to calculate the most important numbers.
What Is a Cleaning Business KPI?
A key performance indicator is a measurable number used to evaluate an important part of your business.
For a cleaning company, useful KPIs may answer questions such as:
- Are our jobs actually profitable?
- How much of our revenue is being spent on labor?
- How much revenue does each labor hour generate?
- Are customers staying with us?
- Are our quotes turning into paying customers?
- How often are quality problems creating additional work?
The purpose of tracking KPIs is not to collect more data.
The purpose is to make better decisions.
A useful KPI should help you identify a problem, measure improvement, or decide where your attention is needed.
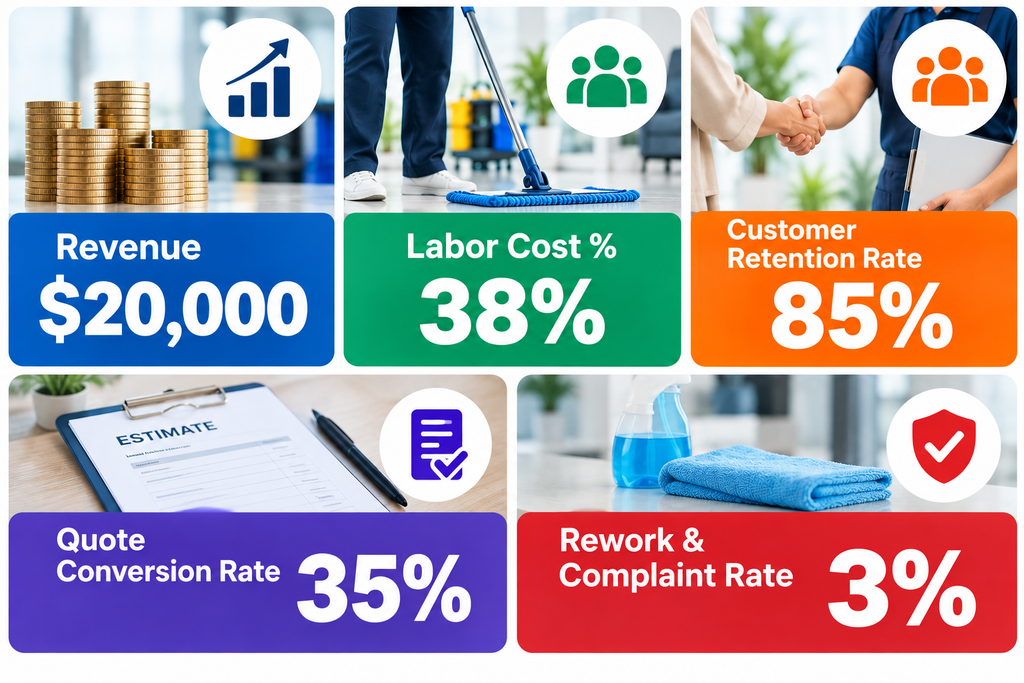
FIGURE 1 — CLEANING BUSINESS KPI DASHBOARD
1. Revenue
Revenue is the total amount your cleaning business earns from customers before expenses are deducted.
It is one of the easiest numbers to track, but it should never be viewed by itself.
Compare revenue over consistent periods such as:
- Weekly
- Monthly
- Quarterly
- Year over year
Breaking revenue down by service type can also be useful.
For example:
- Recurring residential cleaning
- Commercial cleaning
- Deep cleaning
- Move-in and move-out cleaning
- One-time services
Growing revenue is generally positive, but only if the additional work produces enough profit to justify the labor and operating costs required to deliver it.
2. Profit Margin
Profit margin shows how much of your revenue remains after expenses.
A simple profit margin formula is:
Profit Margin = Profit ÷ Revenue × 100
For example, suppose your cleaning business generates $20,000 in revenue and has $17,000 in total expenses.
Your profit is:
$20,000 − $17,000 = $3,000
Your profit margin is:
$3,000 ÷ $20,000 × 100 = 15%
Revenue growth can look impressive while profit margin is shrinking, which is why both numbers should be monitored together.
You can use our Cleaning Business Profit Margin Calculator to calculate your margin and see how changes in revenue or expenses affect profitability.
3. Labor Cost Percentage
Labor is one of the most important costs to monitor in a cleaning business.
Labor cost percentage shows how much of your revenue is being consumed by labor.
The basic formula is:
Labor Cost Percentage = Total Labor Cost ÷ Revenue × 100
If a job produces $500 in revenue and its true labor cost is $200:
$200 ÷ $500 × 100 = 40%
Tracking this percentage over time can help identify jobs where labor requirements are increasing faster than revenue.
Remember that true labor cost may include more than hourly wages.
Payroll taxes, workers’ compensation, benefits, paid time, and other employer costs may increase the actual cost of each labor hour.
Our Cleaning Labor Cost Calculator can help you estimate the true labor cost of a cleaning job.
4. Revenue per Labor Hour
Revenue per labor hour measures how much revenue your business generates for each labor hour used.
The formula is:
Revenue per Labor Hour = Revenue ÷ Total Labor Hours
Suppose a job generates $480 and requires 8 total labor hours.
$480 ÷ 8 = $60 per labor hour
If another similar job generates the same $480 but requires 10 labor hours:
$480 ÷ 10 = $48 per labor hour
The second job uses more labor to generate the same amount of revenue.
This does not automatically mean the crew is performing poorly. The estimate, service scope, equipment, property layout, or pricing may be responsible.
Use revenue per labor hour as a signal to investigate.
For a deeper look at measuring labor efficiency, see our guide to cleaning staff productivity.
FIGURE 2 — REVENUE ALONE VS KPI VIEW
5. Job Profitability
Company-wide profit can hide individual jobs that are performing poorly.
That is why it is useful to review profitability at the job or customer level.
A basic job profit calculation is:
Job Profit = Job Revenue − Direct Job Costs
Direct job costs may include:
- Labor
- Cleaning supplies
- Job-specific equipment costs
- Travel or mileage
- Subcontractor costs
- Other costs directly associated with the job
Suppose a recurring cleaning job generates $600.
If direct labor and other job costs total $420:
$600 − $420 = $180 job profit
Tracking job profitability helps identify accounts that may need repricing, a different process, a revised scope, or a more accurate labor estimate.
A busy schedule is not automatically a profitable schedule.
6. Average Job Value
Average job value shows the average amount of revenue generated each time you complete a job.
The formula is:
Average Job Value = Total Job Revenue ÷ Number of Jobs Completed
If your business generates $18,000 from 120 completed jobs:
$18,000 ÷ 120 = $150 average job value
Track this metric over time and, when useful, by service type.
A change in average job value may reflect:
- Pricing changes
- Changes in your customer mix
- More premium services
- More small one-time jobs
- Upsells or additional services
Average job value becomes more useful when viewed alongside job profitability rather than as a standalone target.
7. Customer Retention Rate
Recurring customers can create predictable revenue, so retention is especially important for cleaning businesses built around repeat service.
A common retention formula is:
Customer Retention Rate = (Customers at End of Period − New Customers Added) ÷ Customers at Start of Period × 100
Suppose you start the quarter with 100 customers.
During the quarter, you add 20 new customers and finish with 105 total customers.
Your retention rate is:
(105 − 20) ÷ 100 × 100 = 85%
When retention begins to decline, investigate why.
Possible causes may include:
- Quality problems
- Poor communication
- Scheduling issues
- Pricing changes
- Cleaner inconsistency
- Customer needs changing
Retention data is more valuable when you also record why customers cancel.
8. Customer Acquisition Cost
Customer acquisition cost, or CAC, estimates how much you spend to acquire a new customer.
A simple formula is:
Customer Acquisition Cost = Sales and Marketing Costs ÷ New Customers Acquired
For example, if you spend $1,500 on marketing during a month and acquire 15 new customers:
$1,500 ÷ 15 = $100 per new customer
This metric becomes especially useful when you compare acquisition cost with the revenue and profit generated by those customers.
A $100 acquisition cost may be reasonable for a valuable recurring customer but expensive for a low-value one-time job.
Track acquisition cost by marketing channel when possible so you can see which sources are producing valuable customers.
9. Quote Conversion Rate
Quote conversion rate measures how many of your estimates or quotes turn into paying customers.
The formula is:
Quote Conversion Rate = Accepted Quotes ÷ Total Quotes Sent × 100
If you send 40 quotes and 14 are accepted:
14 ÷ 40 × 100 = 35%
A low conversion rate does not automatically mean your price is too high.
Other possible reasons include:
- Slow follow-up
- Poorly qualified leads
- Unclear quotes
- Weak trust signals
- Service mismatch
- Competitors offering a better fit
Likewise, an extremely high conversion rate is not always ideal if you are consistently underpricing your services.
Use conversion rate together with profitability rather than chasing the highest possible percentage.
10. Rework and Complaint Rate
Labor efficiency means little if crews have to return and clean the same work again.
Track how often completed jobs create:
- Customer complaints
- Callbacks
- Free return visits
- Recleaning
- Failed inspections
A simple rework rate can be calculated as:
Rework Rate = Jobs Requiring Rework ÷ Total Jobs Completed × 100
If 6 of 200 completed jobs require additional cleaning:
6 ÷ 200 × 100 = 3%
Track the reason for each issue rather than recording only the total.
Repeated problems can reveal weaknesses in training, SOPs, job instructions, equipment, staffing, or quality control.
Our Cleaning Business Quality Control Checklist can help you create a repeatable inspection process.
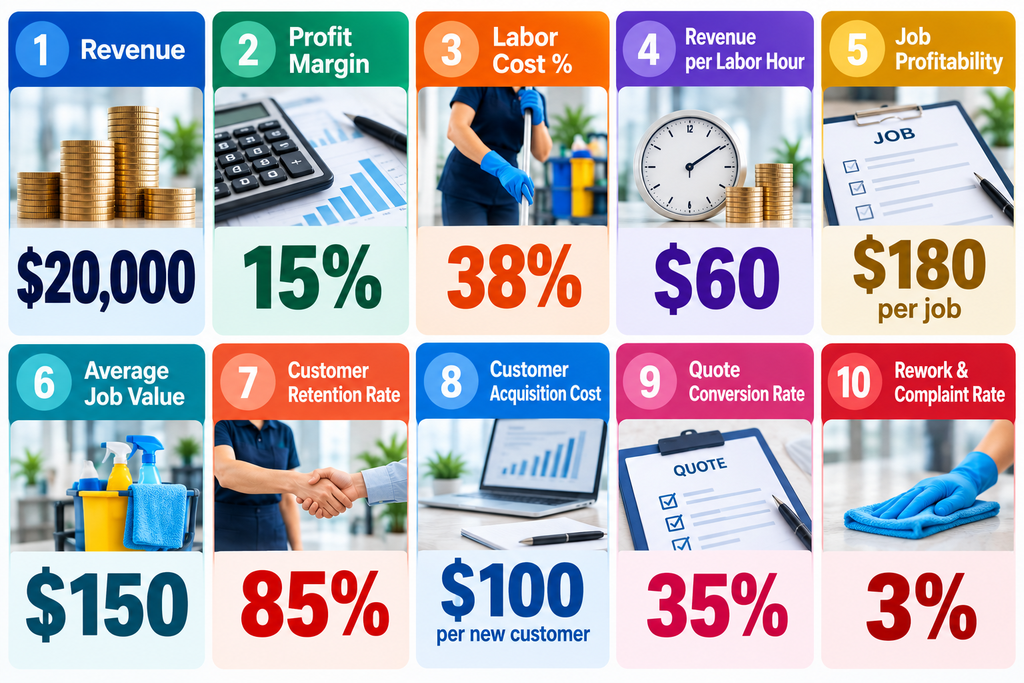
FIGURE 3 — 10 CLEANING BUSINESS KPIs
Cleaning Business KPI Dashboard
Tracking each KPI separately can make it difficult to see the overall picture.
Use the dashboard below to calculate several important cleaning business KPIs from one set of operating numbers.
Enter your revenue, expenses, labor cost, labor hours, jobs, customer numbers, marketing costs, quotes, and rework data.
Your KPI Results
These KPIs are intended to help you understand trends in your cleaning business. Results vary by service type, market, pricing, labor structure, and operating model. Compare your numbers over time rather than treating any single result as a universal benchmark.
The dashboard calculates:
- Profit
- Profit margin
- Labor cost percentage
- Revenue per labor hour
- Average job value
- Customer retention rate
- Customer acquisition cost
- Quote conversion rate
- Rework rate
No single KPI tells you whether your business is performing well.
Look at the relationship between the numbers.
For example, revenue may be increasing while profit margin falls. Labor efficiency may improve while rework rises. Quote conversion may increase while average job profitability declines.
The combination tells you much more than one number alone.
How Often Should You Review Cleaning Business KPIs?
Not every KPI needs to be reviewed at the same frequency.
A practical approach is to separate operational metrics from higher-level business metrics.
Weekly or frequently:
- Labor hours
- Revenue per labor hour
- Job profitability
- Rework and complaints
Monthly:
- Revenue
- Profit margin
- Labor cost percentage
- Average job value
- Quote conversion rate
- Customer acquisition cost
Monthly or quarterly:
- Customer retention
- Longer-term KPI trends
The exact schedule depends on the size and complexity of your business.
What matters most is reviewing the numbers consistently enough to notice meaningful changes.
Compare Trends, Not Just Individual Numbers
A KPI becomes much more useful when you can compare it with previous periods.
Instead of asking:
“What is our labor cost percentage?”
Ask:
“How has our labor cost percentage changed over the last six months?”
The same principle applies to profit margin, customer retention, revenue per labor hour, conversion rate, and rework.
A single number is a snapshot.
A trend shows direction.
Tracking trends can help you identify problems earlier and determine whether operational changes are actually improving performance.
Do Not Compare Every Cleaning Business to the Same Benchmark
It can be tempting to search for one “good” number for every KPI.
But cleaning businesses can have very different economics.
Results can vary based on:
- Residential vs. commercial cleaning
- Geographic market
- Employee wages
- Service frequency
- Property size
- Service scope
- Customer mix
- Business maturity
- Equipment and processes
External benchmarks can provide context, but your own historical performance is often one of the most useful comparisons.
Build a baseline first, then look for sustainable improvement.
Turn KPI Data Into Action
Tracking KPIs has little value if the numbers never change what you do.
When a metric moves in the wrong direction, identify the operational question behind it.
For example:
- Profit margin falling? Review pricing and expenses.
- Labor cost percentage rising? Review job hours, labor cost, and pricing.
- Revenue per labor hour falling? Review productivity and job estimates.
- Retention falling? Review cancellations, quality, and communication.
- Acquisition cost rising? Review marketing channels and lead quality.
- Quote conversion falling? Review lead qualification, pricing, follow-up, and quote clarity.
- Rework increasing? Review training, SOPs, and quality control.
The KPI tells you where to look. Your operating data helps explain why.
Keep Your KPI Data in One Place
As your cleaning business grows, useful operating data becomes spread across schedules, customer records, jobs, invoices, payments, and employee activity.
Keeping this information organized makes it easier to understand what is happening across the business.
Keep Your Cleaning Business Organized
Jobber helps cleaning businesses manage customers, scheduling, jobs, quotes, invoicing, and payments in one system.
Software will not decide which KPIs matter for your business, but organized operational data makes useful measurement much easier as your company grows.
Start With a Small Cleaning Business Scorecard
You do not need to track every possible number from day one.
Start with a small scorecard that gives you visibility into the major parts of the business.
A practical starting point is:
- Revenue
- Profit margin
- Labor cost percentage
- Revenue per labor hour
- Job profitability
- Customer retention
- Rework or complaint rate
Once those numbers are consistently tracked, add acquisition cost, quote conversion, average job value, or other metrics that support your decisions.
The goal is not to create the biggest dashboard.
The goal is to know whether your cleaning business is becoming more profitable, efficient, reliable, and sustainable.
Track the numbers that help you make decisions—and act when those numbers tell you something has changed.