
Revenue per employee measures how much revenue your cleaning business generates per employee over a given period.
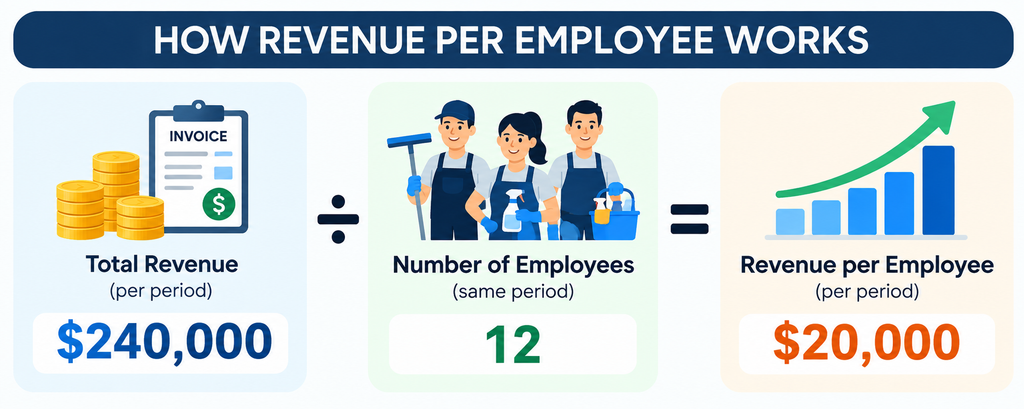
Revenue per Employee = Total Revenue ÷ Number of Employees
For example, a cleaning business generating $240,000 in annual revenue with 12 employees has $20,000 in annual revenue per employee.
Use this metric to track how revenue changes as your team grows. However, a higher number isn’t always better—compare it with labor costs, profit margins, overtime, and service quality before making staffing decisions.
What Is Revenue per Employee in a Cleaning Business?
To calculate revenue per employee accurately, use revenue and employee figures from the same reporting period.
For example, the illustration below shows a cleaning business with $240,000 in annual revenue and 12 employees, resulting in $20,000 in annual revenue per employee.
If your workforce changes significantly during the year, use an average employee count rather than relying only on your year-end headcount.
Revenue per employee is an efficiency metric. It does not tell you how much profit each employee creates or how productive an individual cleaner is.
That distinction matters because two cleaning businesses can report the same revenue per employee while having very different payroll costs, schedules, margins, and service quality.
Do not use revenue per employee as an individual employee performance score.
It is primarily a business-level metric for understanding how revenue and staffing relate.
Cleaning Business Revenue per Employee Calculator
Use the calculator below to measure your current revenue per employee and estimate the revenue required to reach a target level with your existing team.
What Employee Count Should You Use?
The employee count you use can significantly affect your revenue per employee calculation. A cleaning business with full-time cleaners, part-time staff, and office employees needs to choose a method that matches what it wants to measure.
Use the table below to select the most appropriate approach.
| Method | Best Used When | Limitation |
|---|---|---|
| Total Headcount | Team structure is relatively stable | Part-time and full-time employees count equally |
| Average Headcount | Staffing changes during the period | Still ignores differences in hours worked |
| Full-Time Equivalent (FTE) | Team has mixed working hours | Requires reliable hours data |
| Cleaning Staff Only | Measuring field-team revenue efficiency | Excludes administrative support |
| All Employees | Measuring company-wide staffing efficiency | Can hide differences between roles |
How to Calculate Full-Time Equivalent (FTE)
FTE converts different working hours into a comparable employee count. For example, if your business defines full-time work as 40 hours per week, two employees working 20 hours each equal 1.0 FTE.
FTE = Total Hours Worked ÷ Full-Time Hours per Employee
Use the same full-time hours standard and reporting period when comparing results. Include administrative staff when measuring company-wide revenue per employee, and use a consistent definition when analyzing cleaning staff separately.
Revenue per Employee Is Not the Same as Cleaner Productivity
Revenue per employee measures revenue relative to workforce size, while cleaner productivity measures how efficiently cleaning work is completed. These are different metrics and should not be used interchangeably.
The table below shows how revenue per employee compares with other important cleaning business performance metrics.
| Metric | Main Question |
|---|---|
| Revenue per Employee | How much revenue does the business generate relative to team size? |
| Revenue per Labor Hour | How much revenue is generated for each labor hour? |
| Jobs per Labor Hour | How much work is completed per labor hour? |
| Labor Cost Percentage | How much of revenue is consumed by labor cost? |
| Profit Margin | How much revenue remains after costs? |
Revenue per employee can increase without cleaners working faster. Better pricing, more efficient scheduling, reduced travel time, and fewer non-billable hours can all improve the result.
Track labor cost percentage and profit margin alongside revenue per employee to make sure higher revenue is translating into healthier business performance.
Why Revenue per Employee Can Be Misleading by Itself
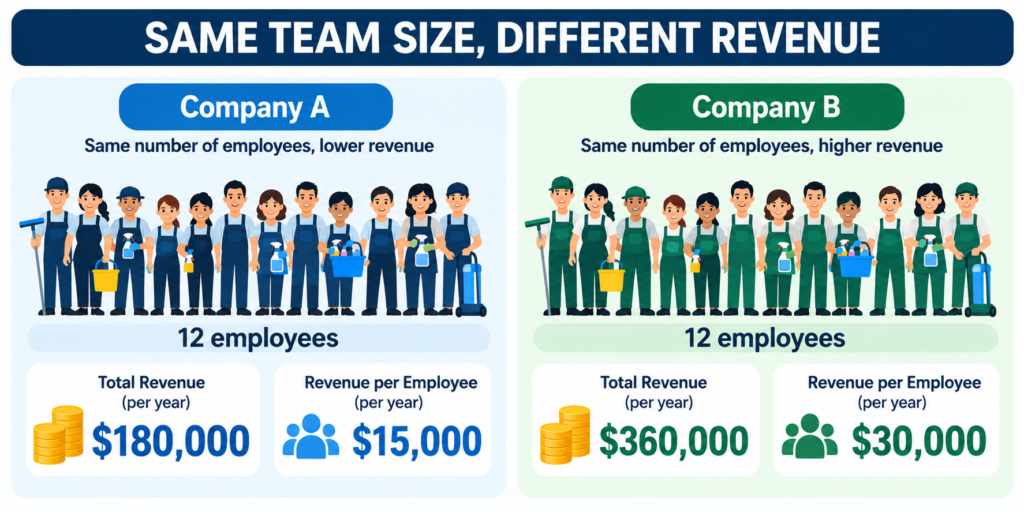
Two cleaning businesses can have the same number of employees but very different revenue per employee.
In the example below, Company B generates twice as much revenue as Company A with the same 12-person team. However, that doesn't necessarily mean Company B is more profitable or better managed. Higher labor costs, overtime, or declining service quality could offset the additional revenue.
Revenue per employee should start an investigation, not end one.
Pair it with labor cost, margins, overtime, quality, and capacity before making staffing decisions.
1. Track Revenue per Employee Over Time
Track revenue per employee monthly, quarterly, or annually using a consistent calculation method. Compare changes in revenue with changes in staffing to identify whether your business is growing efficiently.
An increase may indicate better pricing or improved capacity utilization, while a decline may signal that staffing has grown faster than revenue. However, seasonal demand, new hires, and changes in working hours can also affect the result, so investigate the cause before making staffing decisions.
2. Compare Revenue Growth With Team Growth
Hiring too early can lower revenue per employee if there isn't enough work to support additional staff. Hiring too late can increase the metric while putting excessive pressure on your existing team.
The example below shows how revenue per employee changes when revenue and employee headcount grow at different rates.
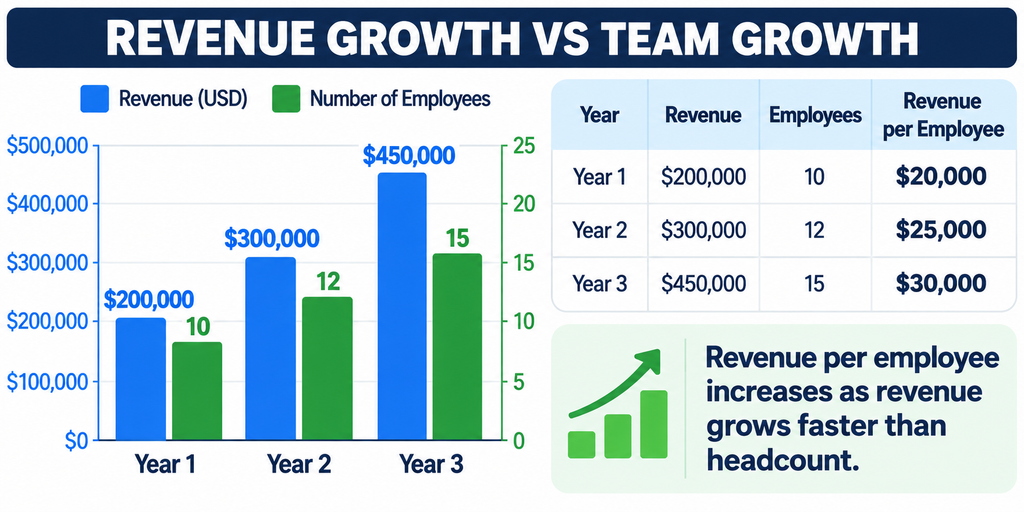
The goal isn't to maximize revenue with the smallest possible team. It's to match staffing levels with profitable customer demand while maintaining service quality and manageable workloads.
3. Improve Pricing Before Pushing for More Output
Revenue per employee can increase without asking your cleaners to complete more jobs. Better pricing can generate more revenue from the same amount of work.
Review whether your rates adequately cover labor, travel, service complexity, and operating costs. If prices are too low, increasing workload may add revenue without improving profitability. Check your pricing before treating low revenue per employee as a productivity problem.
4. Reduce Non-Billable Time
Travel between jobs, schedule gaps, callbacks, supply runs, and administrative delays can consume paid working hours without generating additional revenue. Reducing avoidable downtime can free up capacity for more cleaning jobs without asking employees to work faster.
| Capacity Leak | What to Examine |
|---|---|
| Excessive Travel | Route density and service areas |
| Schedule Gaps | Dispatching and appointment timing |
| Callbacks | Quality control and training |
| Supply Runs | Inventory and restocking process |
| Administrative Delays | Scheduling and job information |
Not all non-billable time is waste. Focus on recurring delays that can be reduced without compromising service quality, employee safety, or necessary preparation.
5. Look at Service Mix
Different cleaning services generate different amounts of revenue and profit relative to the labor hours and resources they require. A high-priced job isn't necessarily the most profitable if it involves excessive travel, supplies, or labor.
Compare revenue per labor hour, direct costs, and profit margins across residential cleaning, commercial contracts, deep cleaning, and specialty services. Focus on the service mix that improves revenue per employee without sacrificing profitability or service quality.
6. Use Scheduling and Route Density to Protect Capacity
Group cleaning appointments by neighborhood and plan routes to minimize travel time between jobs. Where possible, schedule recurring customers on the same days and leave realistic buffers for traffic, setup, and unexpected delays.
Before expanding your service area, compare the additional revenue with the travel time and operating costs involved. More customers won't necessarily improve revenue per employee if crews spend too much of their paid time on the road.
7. Know When a High Number Is a Warning
Higher revenue per employee isn't always a sign of a healthier cleaning business. Check the following warning signals to see whether revenue growth is putting too much pressure on your team.
| Warning Signal | What It May Indicate |
|---|---|
| Rising Overtime | Team capacity may be too tight |
| More Callbacks | Quality may be slipping |
| Increasing Complaints | Workload may be affecting service |
| High Turnover | Staffing model may be unsustainable |
| Schedule Backlog | Demand may exceed available capacity |
| Declining Margins | Revenue growth may not be profitable |
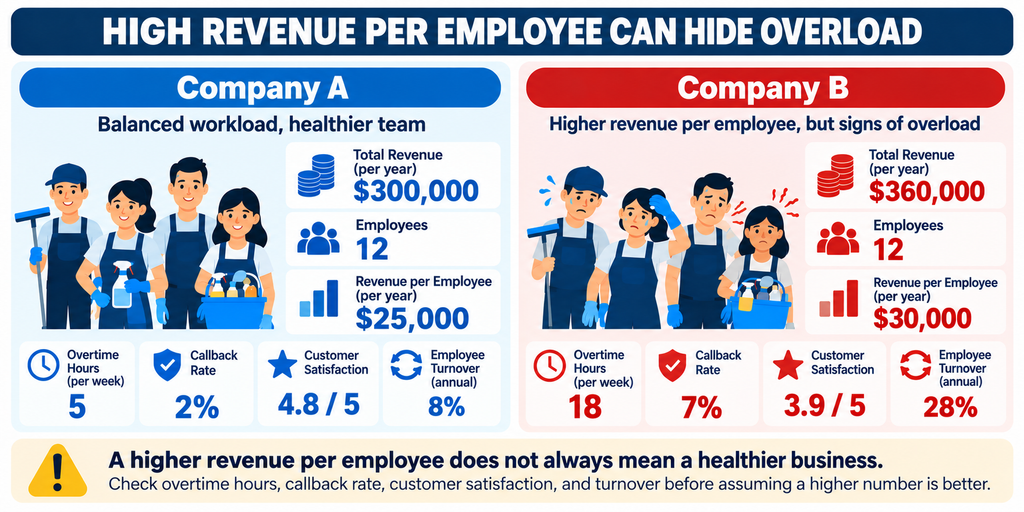
If revenue per employee rises while overtime, complaints, or turnover worsen, investigate workload and staffing capacity before pushing for further growth.
Key Metrics to Track Alongside Revenue per Employee
Revenue per employee is most useful when viewed alongside profitability, labor efficiency, and service quality. The table below explains which supporting metrics to monitor and why each one matters.
| Metric | Why Track It |
|---|---|
| Revenue per Employee | Revenue relative to workforce size |
| Revenue per Labor Hour | Revenue relative to labor time |
| Labor Cost Percentage | Payroll burden relative to revenue |
| Overtime | Capacity pressure |
| Gross or Contribution Margin | Economic quality of revenue |
| Callback Rate | Quality and rework |
| Customer Retention | Service sustainability |
| Employee Turnover | Workforce sustainability |
Review these metrics together rather than trying to maximize each one independently. If revenue per employee improves while overtime, callbacks, or turnover increase, investigate the trade-off before making further changes.
How to Improve Revenue per Employee Without Overloading Your Team
There are several ways to improve the metric, but they do not all involve asking employees to complete more jobs.
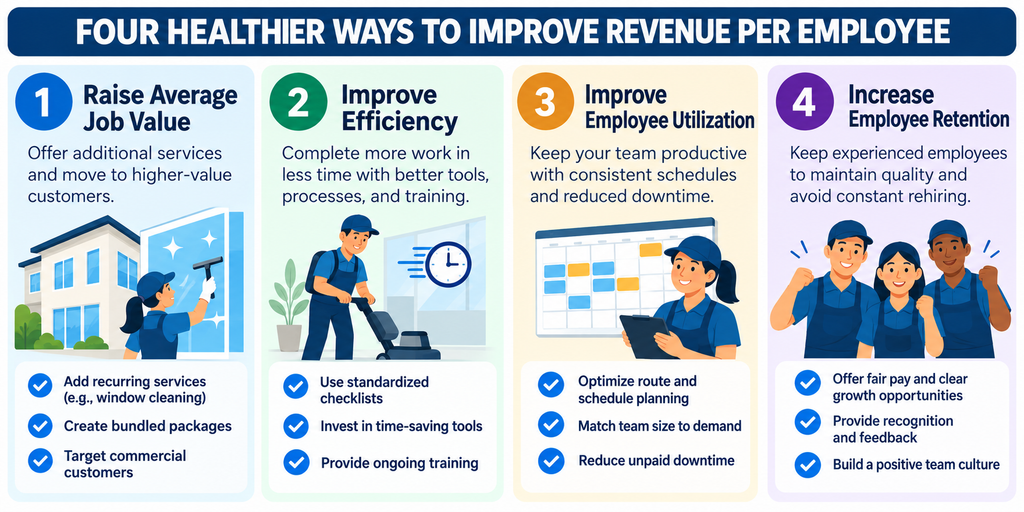
Improving revenue per employee doesn't have to mean increasing each cleaner's workload. Focus on higher-value services, better scheduling, less wasted time, and employee retention to generate more revenue from your existing capacity while maintaining service quality.
Know When It Is Time to Hire
Before hiring, check whether your existing team has unused capacity that could be recovered through better scheduling, routing, or processes.
Additional staff may be justified when customer demand consistently exceeds available capacity, overtime is increasing, and profitable jobs are being delayed or turned away. Evaluate the expected revenue, labor costs, and workload before adding employees.
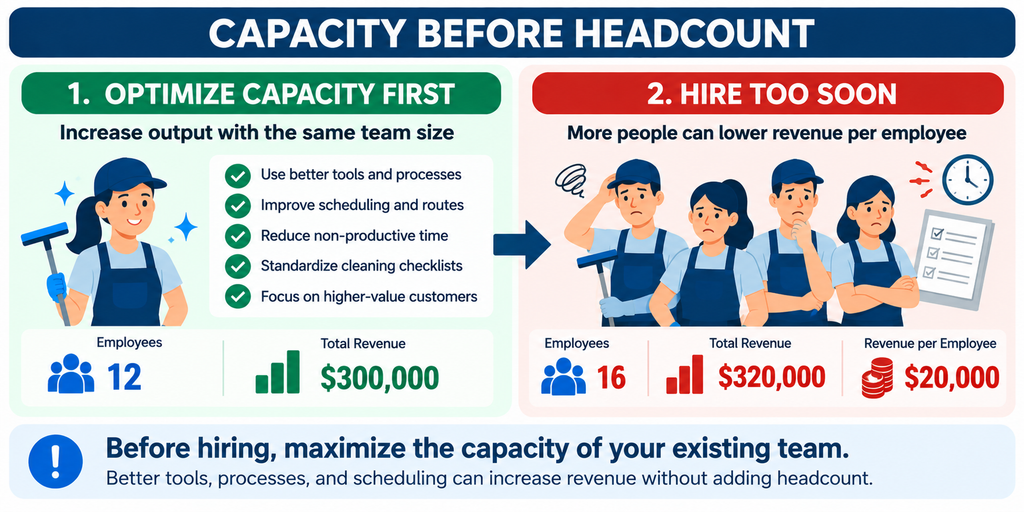
Hiring decisions should combine demand, capacity, labor economics, and service quality rather than rely on a single revenue benchmark.
Keep Revenue, Jobs, and Team Data Connected
When revenue, employee schedules, job records, and invoices are stored separately, it becomes harder to identify which services, teams, or scheduling patterns are driving revenue.
Keeping these records connected helps you compare revenue with staffing levels, track completed jobs, and spot operational inefficiencies before making hiring or pricing decisions.
Manage Your Cleaning Business With Jobber
Jobber brings customer records, quotes, scheduling, job management, invoicing, and payments into one platform, reducing the need to manage each step separately.
Revenue per Employee Is an Efficiency Signal — Not a Target
Revenue per employee is a useful measure of business efficiency, but a higher number doesn't automatically mean a healthier cleaning business. Evaluate it alongside labor costs, profit margins, service quality, and employee workload.
Use these insights to make better decisions about pricing, scheduling, service mix, and hiring. The goal is sustainable, profitable growth—not simply generating more revenue with fewer employees.