
Revenue per labor hour shows how much revenue your cleaning business generates for each hour of labor used to deliver its services.
For a labor-intensive business like cleaning, this can be more useful than simply looking at total revenue or revenue per employee.
It helps you answer a practical question:
How effectively are your paid labor hours being converted into revenue?
A low result does not automatically mean your cleaners are working too slowly. Pricing, travel time, schedule gaps, service mix, callbacks, and other factors can all affect the number.
This guide explains how to calculate revenue per labor hour, interpret it correctly, and improve it without sacrificing cleaning quality.
What Is Revenue per Labor Hour?
Revenue per labor hour measures the amount of revenue generated relative to the labor hours used during the same period.
The basic formula is:
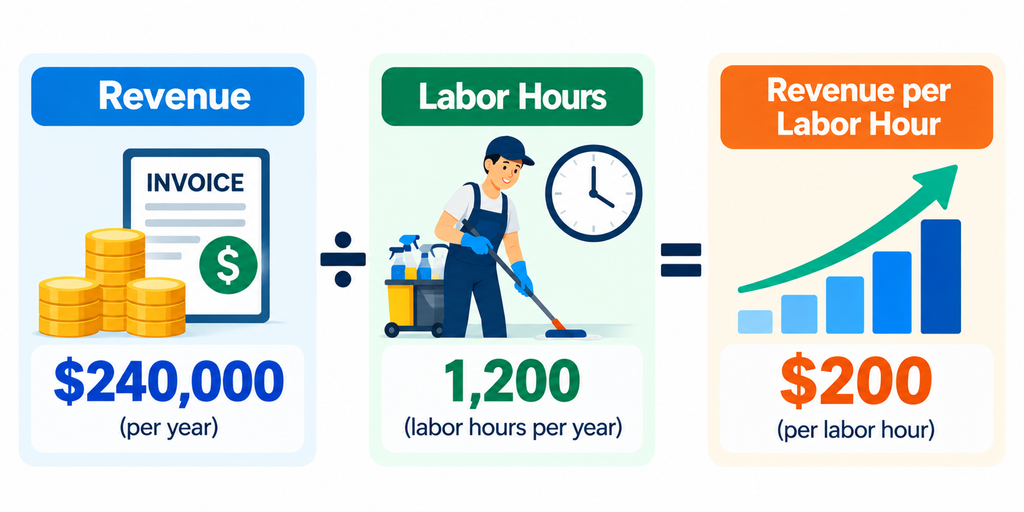
Revenue per Labor Hour = Revenue ÷ Labor Hours
For example, the calculation can be applied to a single job, a week, a month, or an entire business period—as long as the revenue and labor hours cover the same period.
FIGURE 1 — HOW REVENUE PER LABOR HOUR WORKS
Revenue per labor hour is not the same as an employee’s hourly wage.
It measures revenue generated relative to labor time. Payroll cost is a separate calculation.
Cleaning Business Revenue per Labor Hour Calculator
Use the calculator below to measure your current revenue per labor hour and estimate how much revenue the same labor capacity would generate at a higher target rate.
Use actual labor hours whenever possible. Estimates can be useful for planning, but inaccurate time records can make the result misleading.
Which Labor Hours Should You Count?
The denominator matters just as much as the revenue.
If you count only time spent actively cleaning, you are measuring something different from a business that includes travel, setup, supply handling, and other paid time.
| Labor-Hour Method | Includes | Best Used For |
|---|---|---|
| Cleaning Hours Only | Time actively performing cleaning | Job-level cleaning efficiency |
| On-Site Paid Hours | Cleaning, setup, and on-site tasks | Service delivery analysis |
| Field Labor Hours | On-site work plus paid field travel | Operational efficiency |
| Total Paid Labor Hours | All paid employee time | Broader labor economics |
There is no single method that fits every analysis.
What matters is defining the method clearly and using it consistently when comparing jobs, teams, or periods.
Revenue per Labor Hour vs. Labor Cost per Hour
These two metrics are closely related, but they answer different questions.
| Metric | What It Measures |
|---|---|
| Revenue per Labor Hour | Revenue generated from each labor hour |
| Labor Cost per Hour | Cost of each labor hour to the business |
Looking at only one side can create a false impression.
A job may generate strong revenue per labor hour but still produce weak economics if wages, payroll taxes, workers’ compensation, or other labor-related costs are unusually high.
Conversely, low labor cost does not make a job attractive if the revenue generated from that labor is too low.
FIGURE 2 — REVENUE PER LABOR HOUR VS LABOR COST
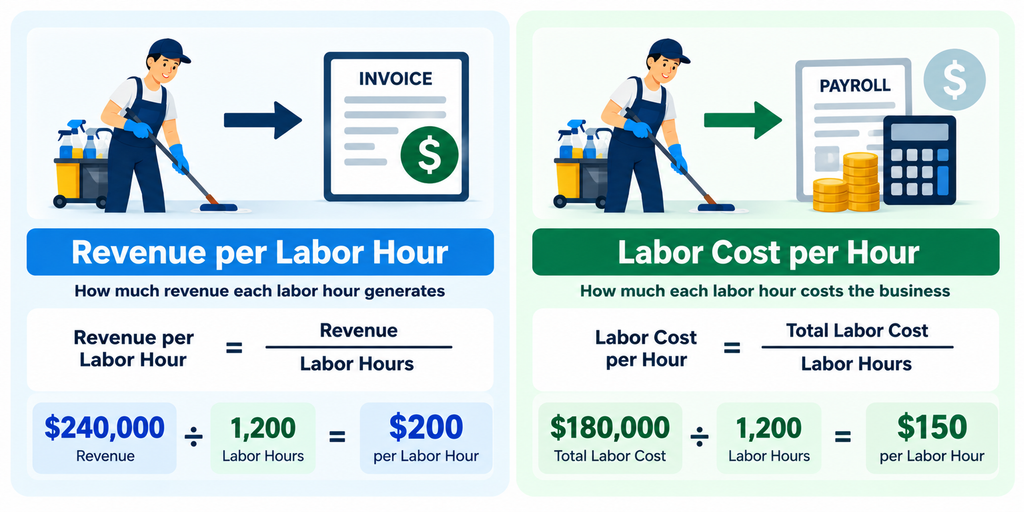
The gap between revenue generated and labor cost is not the same as profit. Supplies, travel, overhead, payment fees, and other costs still need to be considered.
Why Revenue per Labor Hour Matters for Cleaning Businesses
Labor is one of the most important capacity constraints in a cleaning company.
You can acquire more customers, increase advertising, or add services—but the work still has to fit within the labor hours available to deliver it.
Revenue per labor hour helps connect that limited capacity with revenue.
It can help identify whether changes in pricing, scheduling, service mix, or operating efficiency are producing better use of the team’s time.
But the metric should not be turned into a speed target for individual cleaners.
The goal is not to make cleaners work faster at any cost.
The goal is to generate healthier revenue from available labor capacity while maintaining quality and sustainable workloads.
1. Compare Jobs Using the Same Labor Definition
A $300 cleaning job is not necessarily more attractive than a $200 cleaning job.
The amount of labor required to deliver each service matters.
FIGURE 3 — SAME REVENUE, DIFFERENT LABOR HOURS
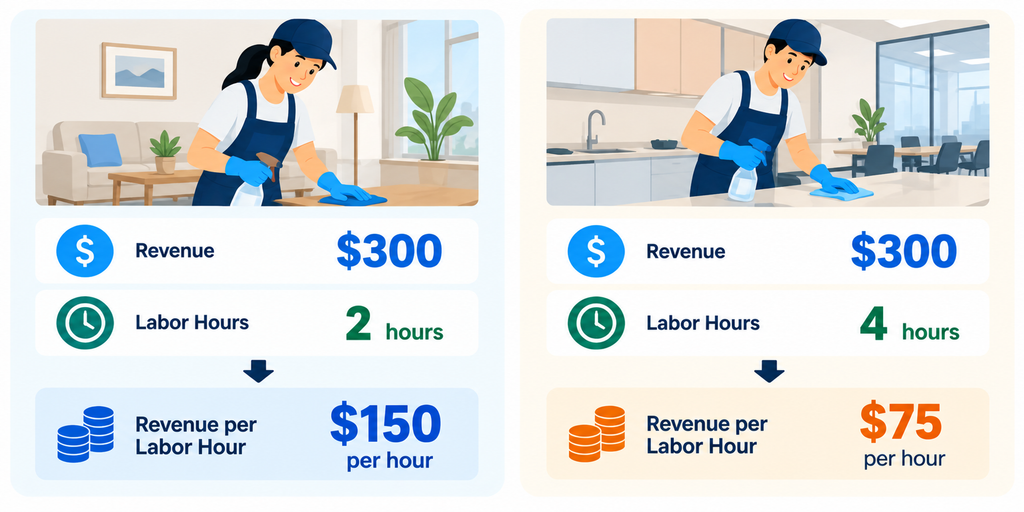
Instead of comparing jobs only by invoice value, compare the revenue generated relative to the labor required.
This can reveal services that occupy large amounts of team capacity without generating proportionate revenue.
2. Improve Pricing When Labor Requirements Increase
Cleaning time can change as customer requirements change.
A property may become more difficult to service. The scope may expand. Customers may request additional tasks. Labor costs may also rise while the price remains unchanged.
When that happens, revenue per labor hour can gradually deteriorate even though the customer continues paying the same invoice amount.
Review jobs where labor requirements consistently exceed what the current price was designed to support.
This does not mean automatically raising every price. It means checking whether price and actual service requirements still match.
3. Reduce Travel and Schedule Gaps
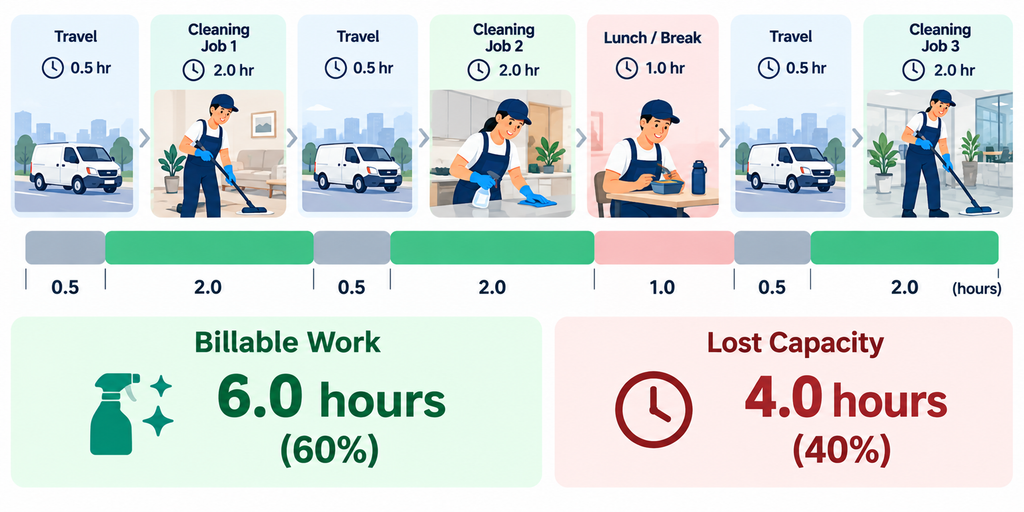
A cleaning team can perform efficiently inside the customer’s property and still lose substantial capacity between jobs.
Common causes include:
| Capacity Loss | What to Review |
|---|---|
| Long Travel | Service area and route density |
| Schedule Gaps | Appointment sequencing |
| Late Access | Customer access procedures |
| Supply Stops | Restocking process |
| Last-Minute Changes | Scheduling and confirmation process |
Reducing avoidable downtime can improve the amount of revenue generated from paid field time without requiring faster cleaning.
FIGURE 4 — BILLABLE WORK VS LOST CAPACITY
4. Reduce Callbacks and Rework
When a team has to return to a property to correct a problem, additional labor time is consumed without necessarily generating additional revenue.
Repeated rework can therefore weaken revenue per labor hour even when the original job looked profitable.
Track why callbacks occur rather than treating them as isolated incidents.
Recurring causes may point to unclear checklists, insufficient training, unrealistic job times, communication problems, or inconsistent quality control.
5. Evaluate Your Service Mix
Different cleaning services can produce very different results from the same amount of labor capacity.
A service that produces higher revenue is not automatically better if it also requires substantially more labor, travel, equipment, or rework.
A useful service-level comparison can include:
| Metric | Why It Matters |
|---|---|
| Average Job Value | Revenue generated per job |
| Labor Hours per Job | Labor capacity required |
| Revenue per Labor Hour | Revenue efficiency |
| Labor Cost | Direct labor economics |
| Callback Rate | Rework risk |
| Contribution Margin | Economic value after variable costs |
Use the combination to identify services that deserve more capacity—and those that may need repricing or operational changes.
6. Understand the Difference Between Utilization and Speed
A cleaner can work efficiently while the business still uses labor capacity poorly.
Consider paid time spent waiting for the next appointment, driving across a large service area, collecting missing supplies, or dealing with incomplete job information.
Those problems are not solved by telling cleaners to move faster.
FIGURE 5 — CLEANING SPEED VS LABOR UTILIZATION
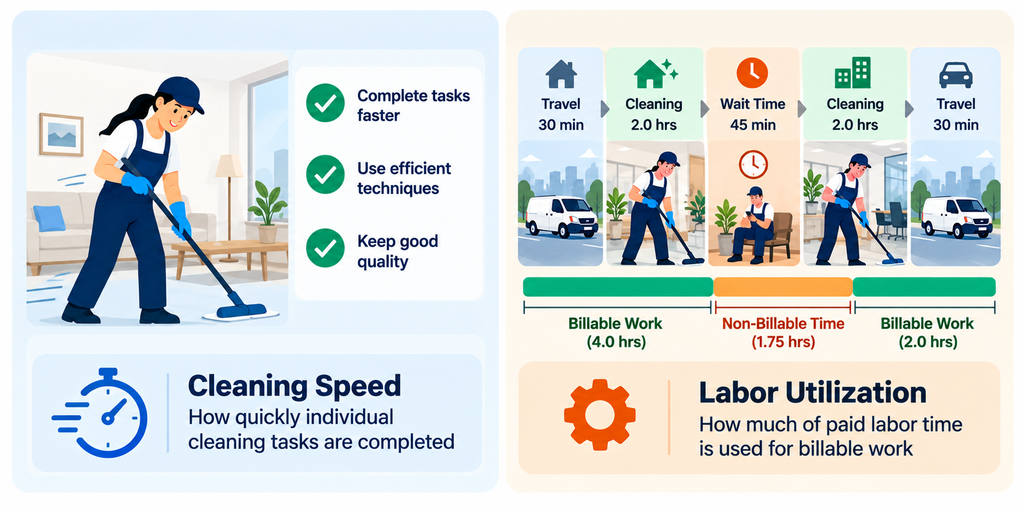
Improving utilization means removing avoidable obstacles around the work so more paid labor capacity can support customer service.
7. Watch for Quality Problems When the Number Rises
A higher revenue-per-labor-hour figure can be positive—but only if the improvement is sustainable.
If employees are being given unrealistic job times, the number may rise temporarily while other indicators deteriorate.
Watch revenue per labor hour alongside:
- Callback rate
- Customer complaints
- Overtime
- Employee turnover
- Missed checklist items
- Customer retention
If revenue efficiency improves while quality or workforce indicators deteriorate, the business may simply be compressing too much work into too little time.
8. Track Revenue per Labor Hour by Segment
A company-wide average can hide important differences.
Instead of relying only on one number, consider comparing meaningful segments such as:
| Segment | What It Can Reveal |
|---|---|
| Residential vs. Commercial | Differences between customer types |
| Recurring vs. One-Time | Impact of repeatable service |
| Service Type | Which services use labor efficiently |
| Team | Operational differences |
| Service Area | Impact of travel and route density |
The purpose is not to create dozens of reports.
Start with the segments that could realistically change a pricing, scheduling, or service decision.
Build a Simple Labor Efficiency Scorecard
Revenue per labor hour becomes more useful when it sits beside a few related metrics.
| Metric | What It Helps You Monitor |
|---|---|
| Revenue per Labor Hour | Revenue efficiency |
| Labor Cost Percentage | Labor cost burden |
| Average Job Value | Revenue per completed job |
| Labor Hours per Job | Time required to deliver service |
| Callback Rate | Rework and quality |
| Overtime | Capacity pressure |
| Contribution Margin | Economic quality of work |
FIGURE 6 — REVENUE PER LABOR HOUR IN CONTEXT
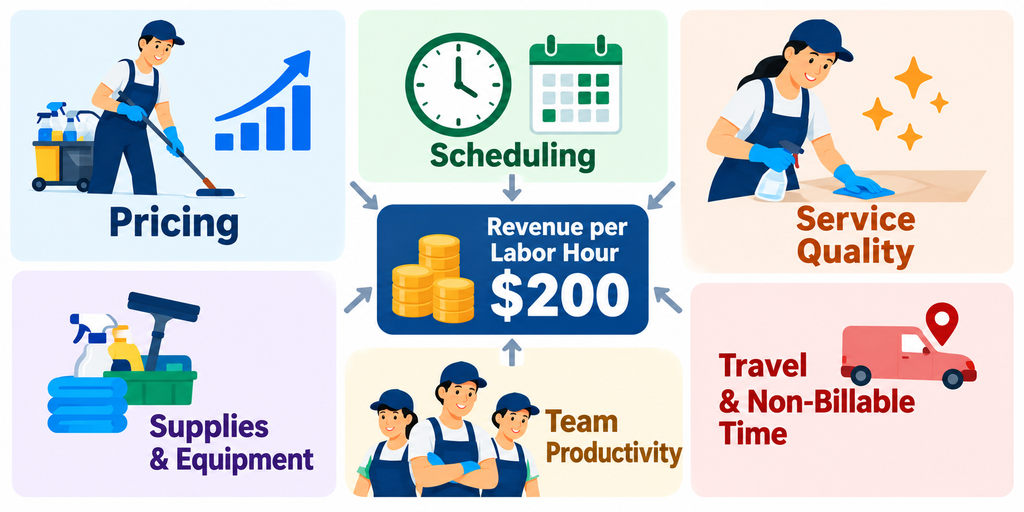
The objective is not to maximize one number. It is to improve labor economics without damaging quality, customer experience, or employee sustainability.
How to Improve Revenue per Labor Hour
Most sustainable improvements come from changing the economics and organization of the work—not simply increasing cleaning speed.
Focus on four areas:
Pricing
Make sure prices reflect the labor actually required to complete the service.
Scheduling
Reduce avoidable travel, gaps, and inefficient appointment sequencing.
Service Mix
Prioritize work that uses labor capacity effectively while producing healthy margins.
Operations
Use clear job information, standardized processes, training, and quality control to reduce wasted time and rework.
When these areas improve together, revenue per labor hour can rise without forcing the cleaning team into an unsustainable workload.
Keep Labor Time and Revenue Data Connected
Revenue-per-labor-hour analysis becomes difficult when time records, schedules, jobs, invoices, and customer information are stored separately.
Reliable analysis requires knowing how much revenue a job generated and how much labor was actually required to deliver it.
Manage Scheduling, Jobs, Customers, and Payments in One Place
Jobber helps cleaning businesses manage customer information, quotes, scheduling, jobs, invoicing, and payments in one system.
Revenue per Labor Hour Is About Better Use of Capacity
Revenue per labor hour connects two limited resources: revenue opportunity and labor time.
Used correctly, it can help you identify pricing problems, inefficient schedules, weak service economics, and wasted capacity.
But a higher number should not come from rushing jobs or overloading employees.
Use it alongside labor cost, margins, quality, overtime, and customer outcomes to understand whether your cleaning business is turning its available labor capacity into sustainable, profitable revenue.